 |
| http://www.ex-parrot.com/~chris/wwwitter/20050407-it_doesnt_matter_how_you_vote_either_way_your_planet_is_doomed.html |
Wednesday, April 9, 2014
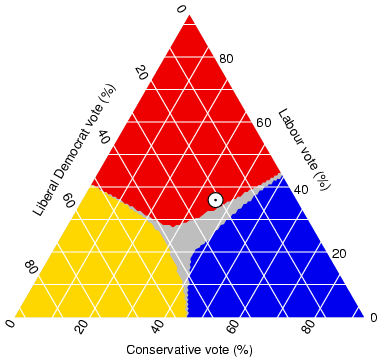
46. Triangular plot
Subscribe to:
Post Comments (Atom)
|
| http://www.ex-parrot.com/~chris/wwwitter/20050407-it_doesnt_matter_how_you_vote_either_way_your_planet_is_doomed.html |
No comments:
Post a Comment